MCUXpresso VSCode extension
Overview
This guide demonstrates how to develop, cross compile and debug applications for the VAR-SOM-MX8M-NANO Cortex-m7 co-processor using NXP’s MCUXpresso for Visual Code extension.
Please visit Variscite's MCUXpresso Guide for additional information about manually building demos, integration with Yocto, running applications from U-Boot and Linux, and JTAG debugging.
Hardware
JTAG Debbugger: J-Link PLUS: https://www.segger.com/products/debug-probes/j-link/models/j-link-plus/
9-Pin Cortex-M Adapter: https://www.segger.com/products/debug-probes/j-link/accessories/adapters/9-pin-cortex-m-adapter/
Variscite Board: Symphony
Host Computer Environment Setup
Follow the steps below to prepare a fresh Ubuntu 22.04 installation for using the extension.
Install Dependencies
$ sudo apt-get -y update
$ sudo apt-get -y install pip git
In order to access serial debugging ports your user must be in the ‘dialout’ group. To check this type:
$ groups
The above command will print all group memberships of the current user. If ‘dialout’ it is not printed, add your user to it:
$ sudo usermod -a -G dialout $USER
and either logout or restart your computer for the changes to take effect.
Download MCUXpresso SDK for the SOM:
$ mkdir -p ~/var-mcuxpresso/mcuxpresso-examples
$ cd ~/var-mcuxpresso
$ git clone https://github.com/varigit/freertos-variscite -b mcuxpresso_sdk_2.15.x-var01
Install VS Code
$ sudo snap install --classic code
Install MCUXpresso for VS Code Extension
VS Code has a graphical interface for installing and managing extensions. To learn more, please see Using extensions in Visual Studio Code
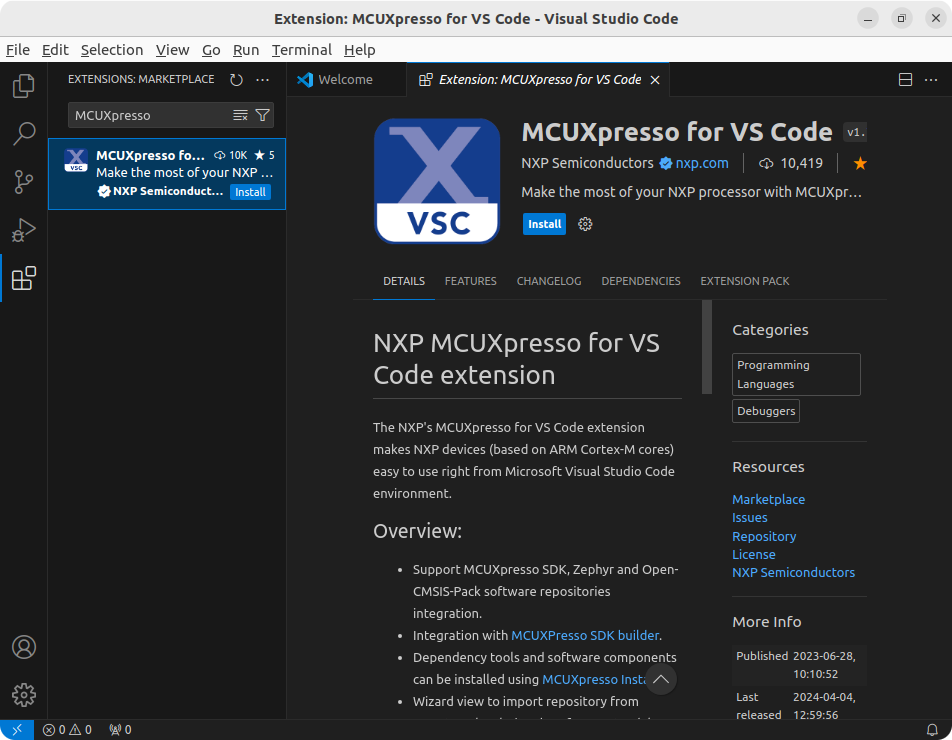
For this guide, we will install the MCUXpresso for VS Code extension:
Install MCUXpresso Dependencies
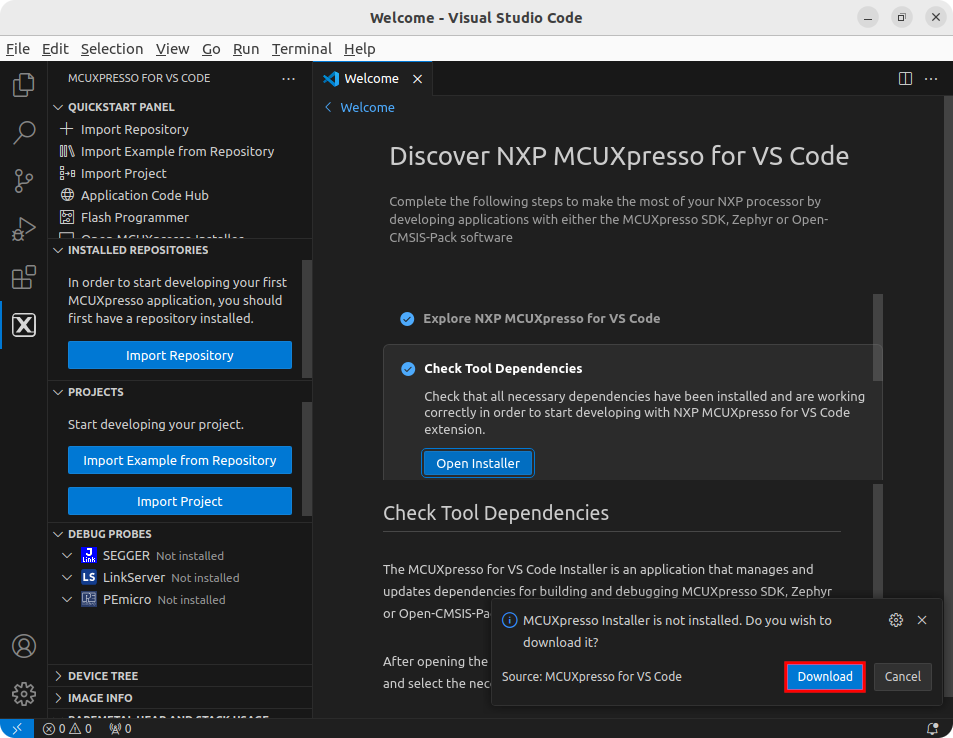
In the extension ‘Welcome' tab, click on ‘Check Tool Dependencies’, ‘Open Installer’ and then, on the bottom right notification, 'Download’:
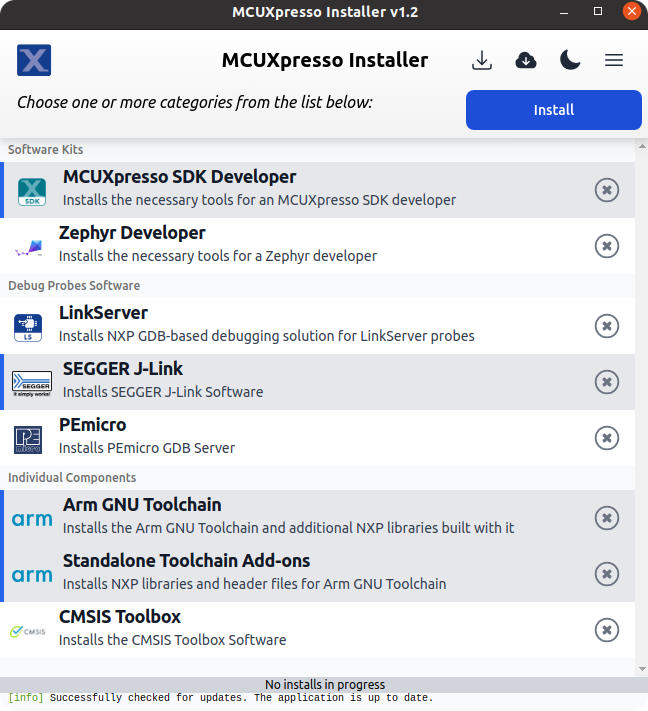
Once the download finishes, the MCUXpresso Installer window will be displayed, showing multiple tools to install. For this guide we will install the following:
- MCUXpresso SDK Developer;
- SEGGER J-Link;
- Arm GNU Toolchain;
- Standalone Toolchain Add-ons.
Open a Demo in VS Code
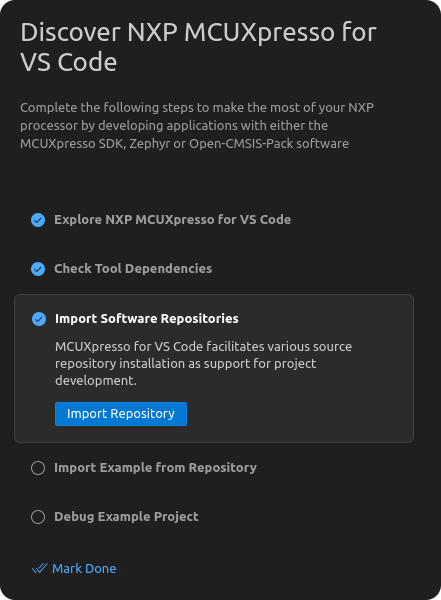
After the dependencies are installed, close the MCUXpresso Installer and click on ‘Import Software Repositories’:
Go to the 'Local' tab, browse the previously git-cloned repository and import it:
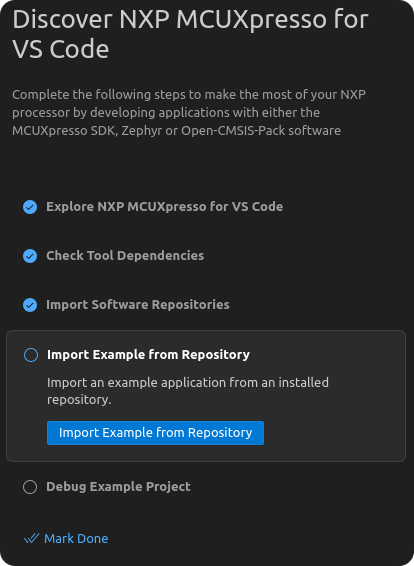
Click on ‘Import Example from Repository’:
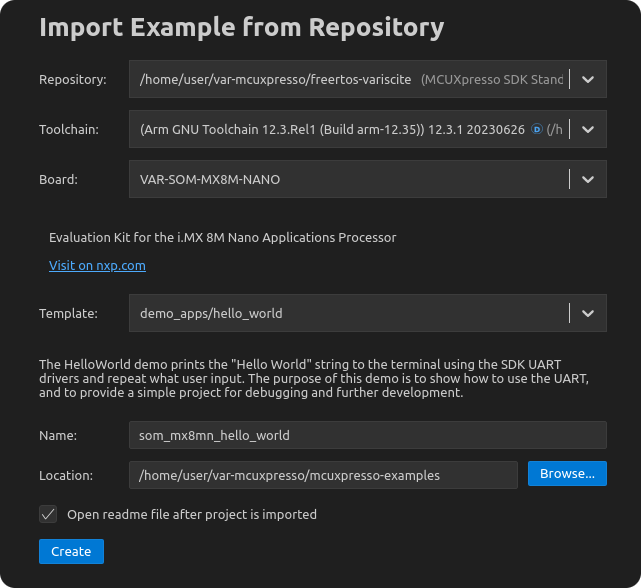
Select the previously imported repository, the Arm GNU Toolchain (the Toolchain version might differ), the VAR-SOM-MX8M-NANO board and the hello world demo. Use the previously created 'mcuxpresso-examples' directory for the 'Location':
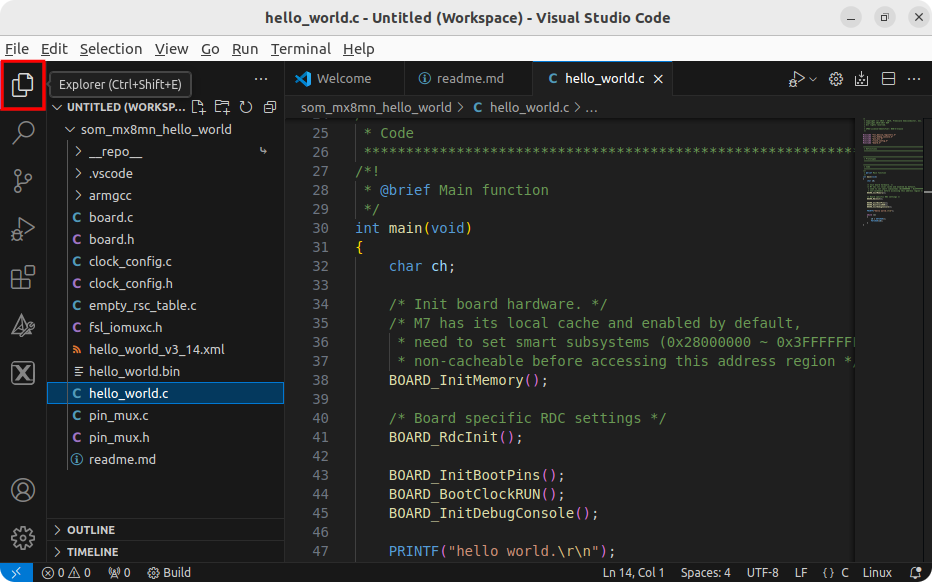
Click on 'Explorer' on the left upper corner to open the project source code:
Build Demo using VS Code
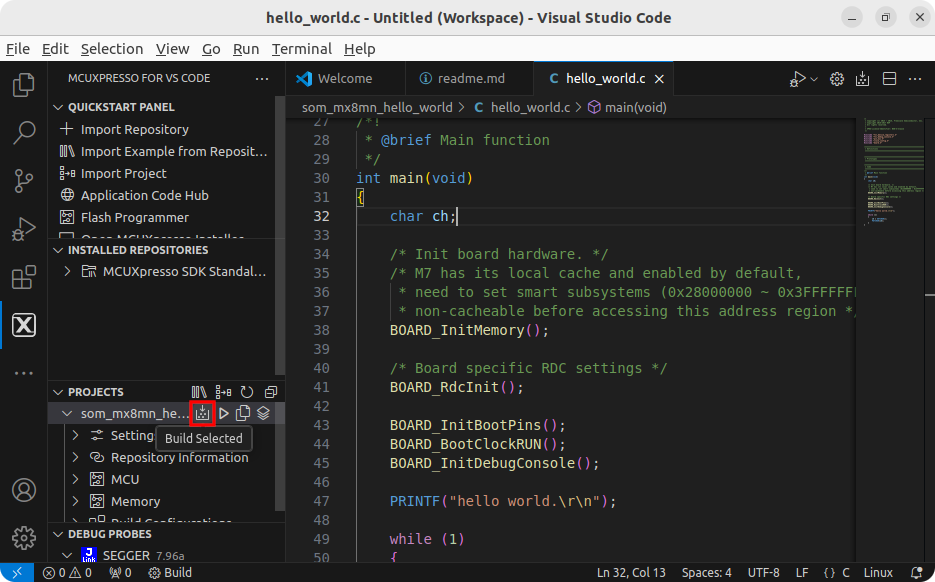
To build the project click on MCUXpresso for VS Code icon on the left and on 'Build Selected':
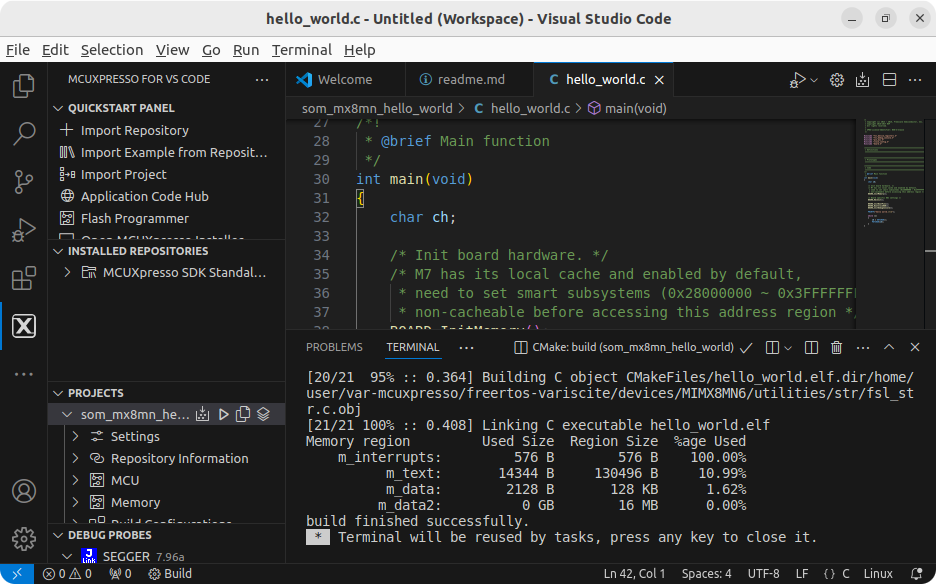
If the build task completes successfully, a similar output as below should be generated:
Please visit Variscite's MCUXpresso Guide for instructions to run the demo using U-Boot or the Linux Remote Processor Framework.
Debugging with VS Code
Test Enviroment
Connect Hardware
Connect J-Link PLUS to JTAG connector of Variscite board
Connect J-Link PLUS to Development PC via USB cable
Load dedicated device tree
Please visit Variscite's MCUXpresso Guide for instructions to load a dedicated device tree.
For this example we will use imx8mn-var-som-symphony-m7.dtb:
From U-Boot
 => setenv fdt_file imx8mn-var-som-symphony-m7.dtb
 => saveenv
 Saving Environment to MMC... Writing to MMC(1)... OK
 Power off / Power on the board
Or, from Linux
 $ fw_setenv fdt_file imx8mn-var-som-symphony-m7.dtb
 $ reboot
Start Debugging
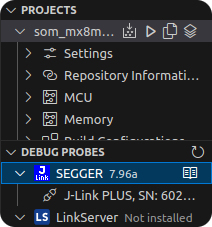
Make sure the Debug Probe is correctly identified by the extension:
If it is not, check your connections and restart VS Code.
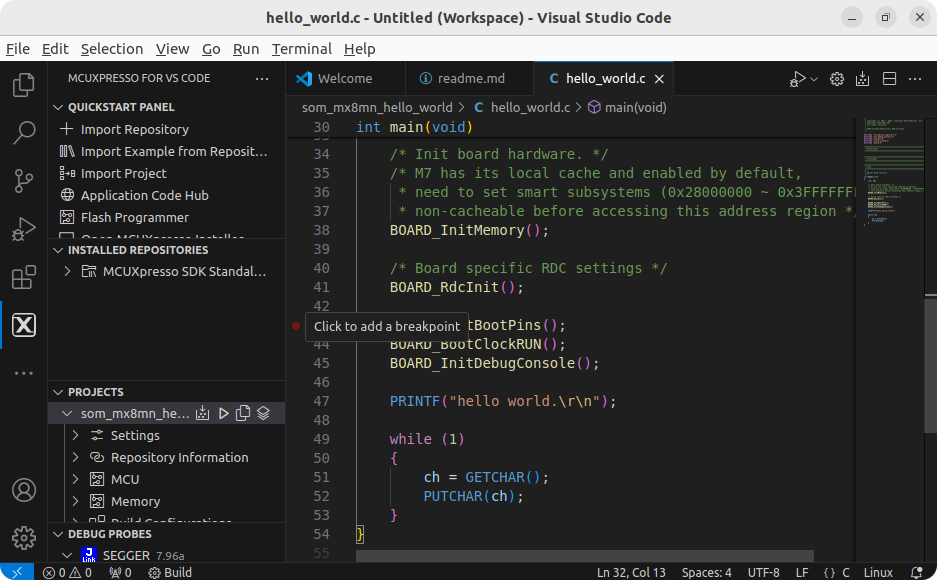
Open source code and add a breakpoint:
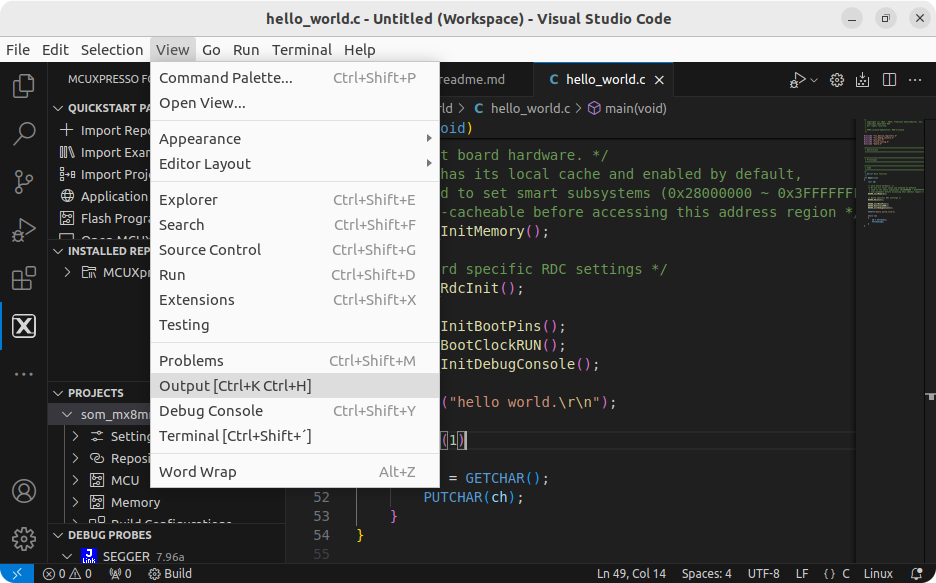
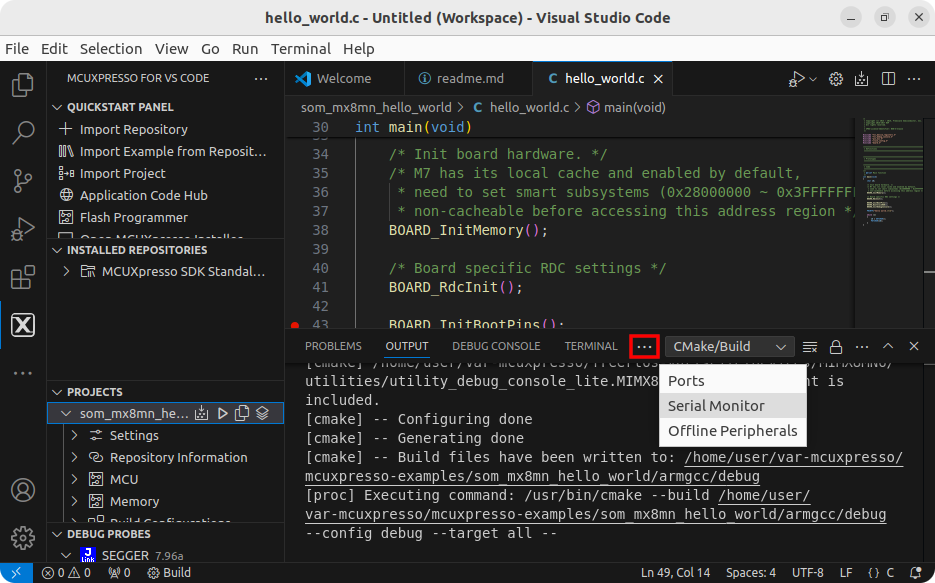
Open the serial debugging port by clicking ‘View' → ‘Output’ → ‘…’ → 'Serial Monitor’:
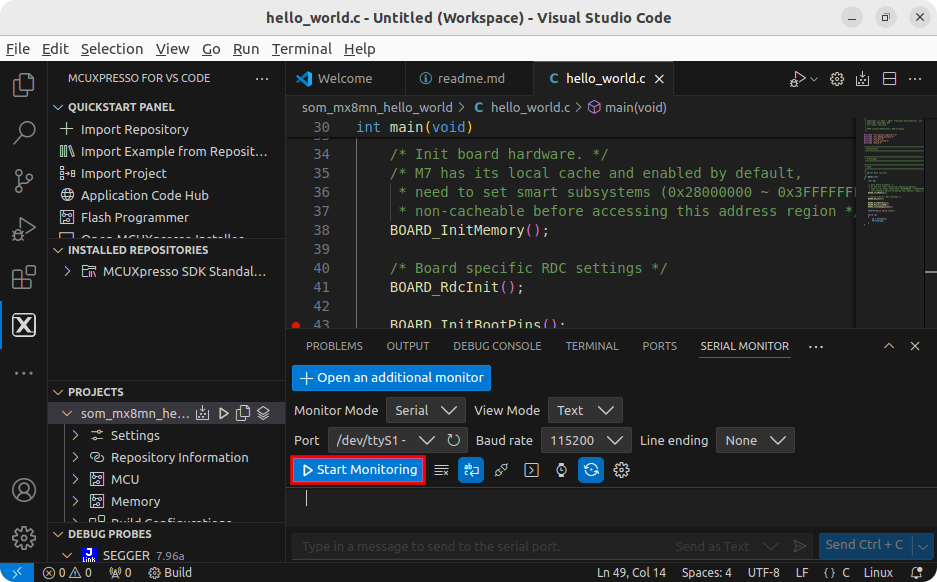
Select the appropriate serial port (it is usually /dev/ttyUSBx) and click on 'Start Monitoring':
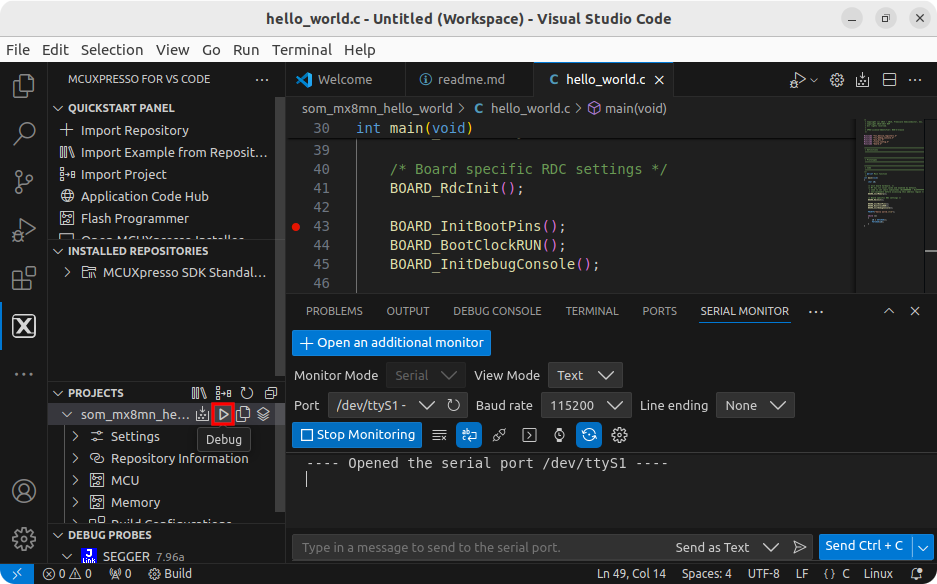
Click on 'Debug' to start debugging:
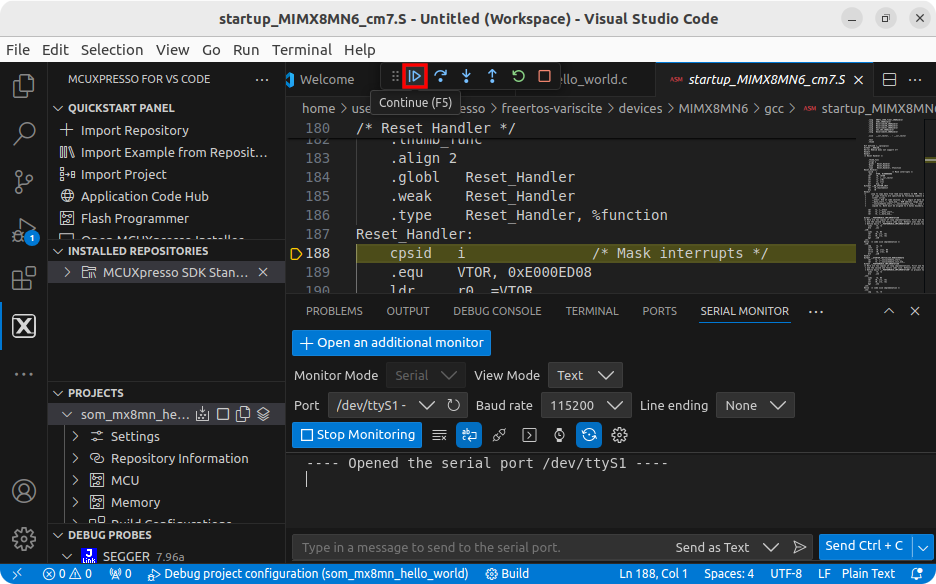
Click on 'Continue' (or press F5) until the breakpoint is reached:
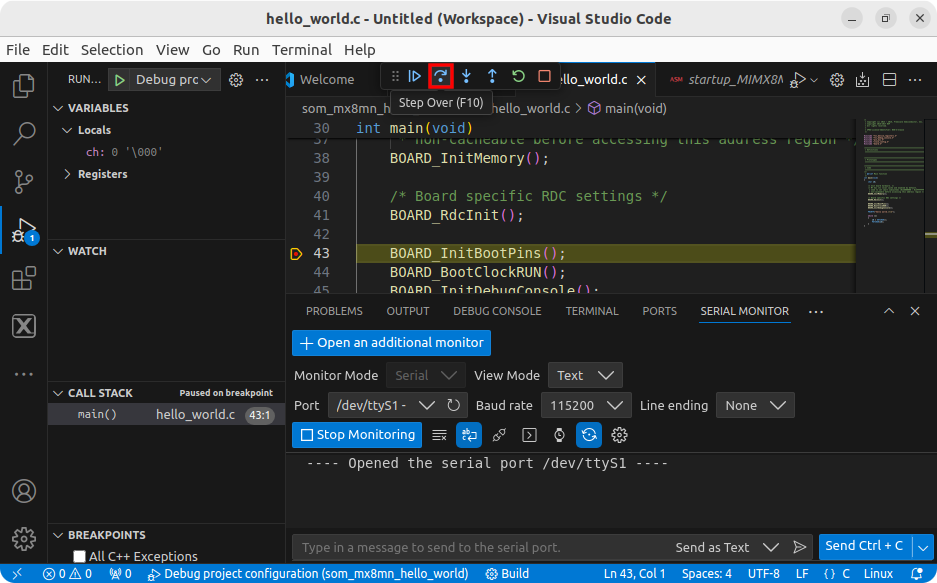
After reaching the breakpoint, click on 'Step Over' (or press F10) to go line by line:
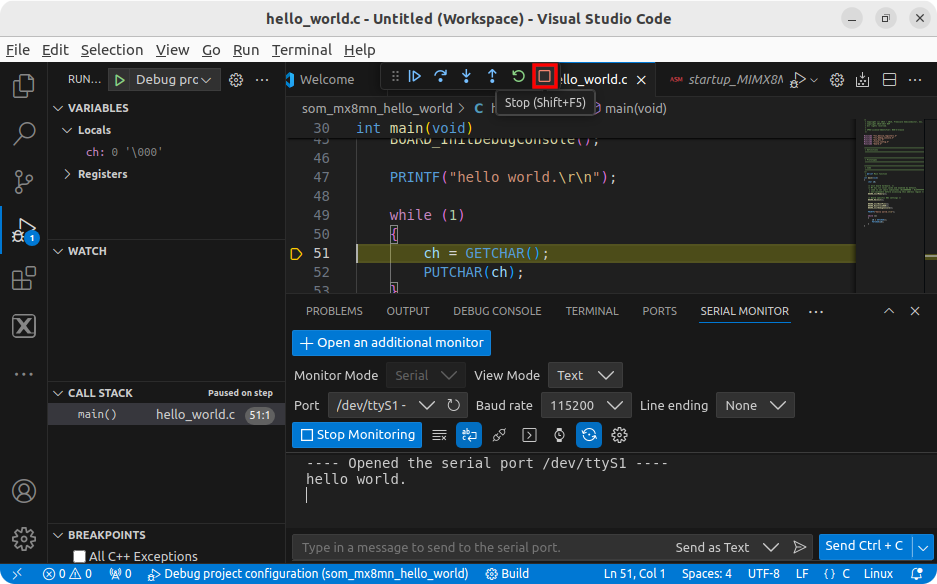
Right after stepping over the PRINTF line, a 'hello world' string should be printed on the serial monitor:
To end the debugging session, press the ‘Stop’ button:
