Yocto Programming with CodeBlocks
Code::Blocks is a free C/C++ IDE built around a plugin framework, designed to be very extensible and fully configurable.
This guide demonstrates how to create and debug a C++ application using Code::Blocks on the DART-MX8M-MINI.
Create your rootfs with Code::Blocks debug support
Debugging with Code::Blocks requires your preferred SSH server (openssh, dropbear, etc.), gdb, and gdbserver installed on the target device.
Append the following to the conf/local.conf file in your Yocto build directory:
EXTRA_IMAGE_FEATURES = " \
    tools-debug \
    ssh-server-dropbear \
    "
Now bitbake your image.
Setup Host Computer Environment
Please follow the steps below to prepare a fresh Ubuntu 20.04 installation for Code::Blocks debugging:
Install Dependencies
$ sudo apt-get -y update
$ sudo apt-get -y install build-essential gdb gdb-multiarch git
Install Code::Blocks
$ sudo apt install codeblocks codeblocks-contrib
Install Yocto Toolchain
A toolchain is necessary for cross compiling applications. To install the toolchain, follow Variscite's Yocto Toolchain installation guide.
Configure Code::Blocks
This section uses the default toolchain path, assuming you followed the default instruction in Variscite's Yocto Toolchain installation guide.
Changes may be required if you installed the toolchain in a different path or used different distro settings.
Configure the debugger
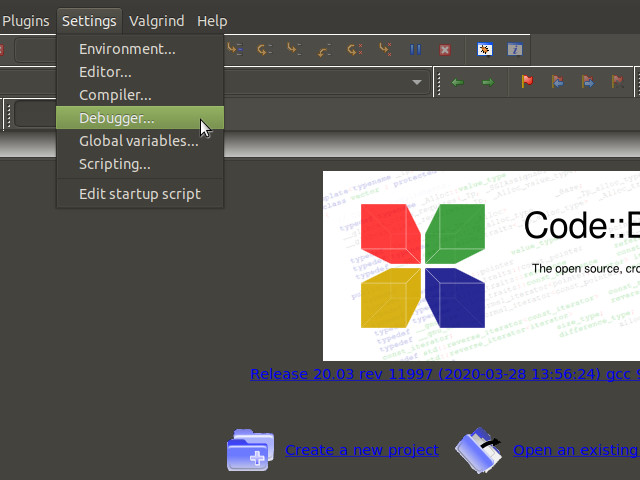
From the menu bar, click on "Settings" and then on "Debugger..."
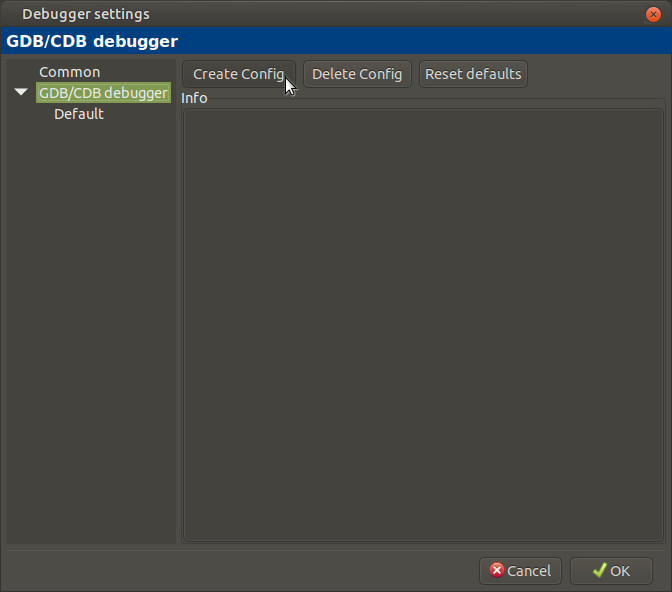
In the "Debugger settings" window, select "GDB/CDB debugger" and click on "Create Config".
In the "Create config" window, enter the new debugger's name and click on "OK".
Select the new configuration in the left pane, and fill in the "Executables path" field.
The default path is:
/opt/fslc-xwayland/3.1/sysroots/x86_64-fslcsdk-linux/usr/bin/aarch64-fslc-linux/aarch64-fslc-linux-gdb
Then, add the set sysroot command in the "Debugger initialization commands" section, to speedup the gdb startup.
The default path is:
set sysroot /opt/fslc-xwayland/3.1/sysroots/aarch64-fslc-linux
Finally, click on "OK".
Configure the compiler
The next steps depend on the previous section: here we assume the debugger is already configured.
From the menu bar, click on "Settings" and then on "Compiler...".
In the "Global compiler settings" window, click on "Copy".
In the "Add new compiler" window, enter the new compiler's name and click on "OK".
A popup windows will remind you to update the "Toolchain executables" page - just click on "OK".
Click on the "Toolchain executables" tab and fill in the fields according your Yocto toolchain.
For the Debugger, in the drop-down list you should select the one created above.
The default settings are
- Compiler's installation directory: /opt/fslc-xwayland/3.1/sysroots/x86_64-fslcsdk-linux/usr/bin/aarch64-fslc-linux
- C compiler: aarch64-fslc-linux-gcc
- C++ compiler: aarch64-fslc-linux-g++
- Linker for dynamic libs: aarch64-fslc-linux-g++
- Linker for static libs: aarch64-fslc-linux-ar
- Debugger: GDB/CDB debugger: Variscite GDB
- Resource compiler: <empty>
- Make program: make
Click on the "Compiler settings" tab, then on the "Other compiler options" tab, and add the appropriate options.
E.g. add the sysroot option:
--sysroot=/opt/fslc-xwayland/3.1/sysroots/aarch64-fslc-linux
Click on the "Linker settings" tab, then on the "Other linker options" tab, and add the appropriate options.
E.g. add the sysroot option:
--sysroot=/opt/fslc-xwayland/3.1/sysroots/aarch64-fslc-linux
Create the reference helper scripts to deploy and debug with Code::Blocks
Here, we will create the following files:
| /home/user/bin/var-sdk.conf | configuration file hosting target parameters |
| /home/user/bin/var-sdk-deploy.sh | script to automate binary deploy |
| /home/user/bin/var-sdk-debug.sh | script to automate binary debug |
Create the file /home/user/bin/var-sdk.conf using the right IP address of the target board:
TARGET_DIR="/home/root"
TARGET_IP="192.168.73.165"
TARGET_PORT="3000"
SSH_OPTIONS="-oStrictHostKeyChecking=no"
Create the file /home/user/bin/var-sdk-deploy.sh:
#!/bin/bash

readonly PROGRAM="$1"
PROGRAMNAME="$(basename $PROGRAM)"

. /home/user/bin/var-sdk.conf

echo "Deploying to target"

# prevent "Host key verification failed"
ssh-keygen -f "${HOME}/.ssh/known_hosts" -R "${TARGET_IP}"

# delete old binary
ssh ${SSH_OPTIONS} root@${TARGET_IP} "sh -c 'rm -rf ${TARGET_DIR}/${PROGRAMNAME}'"

# send the program to the target
scp ${PROGRAM} root@${TARGET_IP}:${TARGET_DIR}/${PROGRAMNAME}
Create the file /home/user/bin/var-sdk-debug.sh:
#!/bin/bash

readonly PROGRAM="$1"
PROGRAMNAME="$(basename $PROGRAM)"

. /home/user/bin/var-sdk.conf

echo "Starting GDB Server on Target"

# kill gdbserver on target
ssh ${SSH_OPTIONS} root@${TARGET_IP} "sh -c '/usr/bin/killall -q gdbserver'"

# start gdbserver on target and fork
ssh ${SSH_OPTIONS} -t root@${TARGET_IP} "sh -c 'XDG_RUNTIME_DIR=/run/user/0 gdbserver localhost:${TARGET_PORT} ${TARGET_DIR}/${PROGRAMNAME}'" &
Finally, make the above .sh files executable:
$ chmod +x /home/user/bin/var-sdk*.sh
Create a sample "Console application" project with Code::Blocks
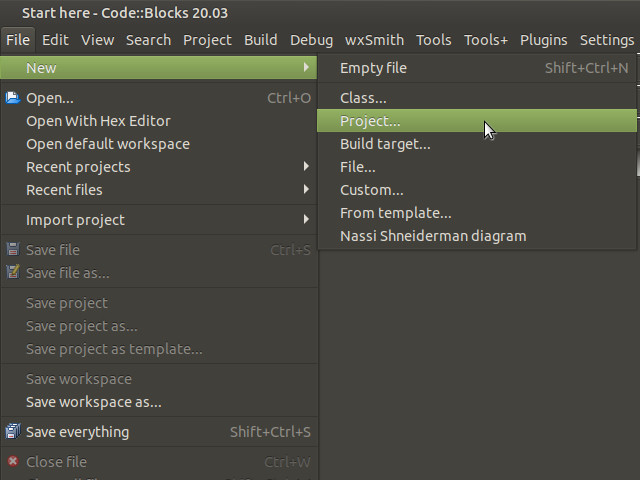
From the menu bar, click on "File", then on "New" and then on "Project...".
In the "New from template" window, select "Console application" and click on "Go".
Unless you prefer changing something, click "Next" in the "Welcome" and "Language" windows.
Fill in the project details according to your preferences and click on "Next".
Select from the drop-down list the compiler configured in the previous section and click on "Finish".
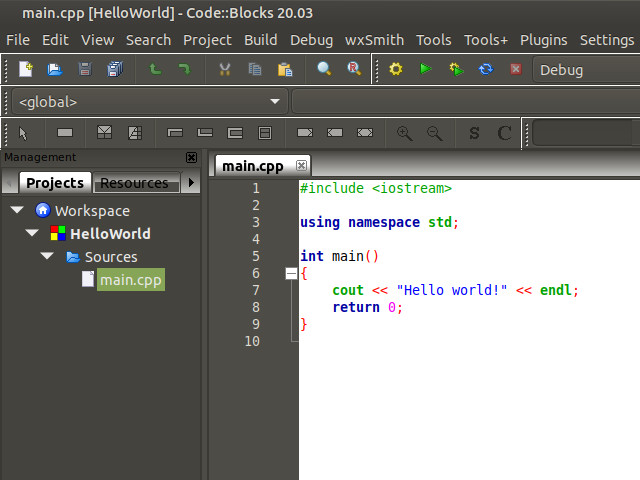
A sample "Hello world" project will show up in the IDE.
Configure the project
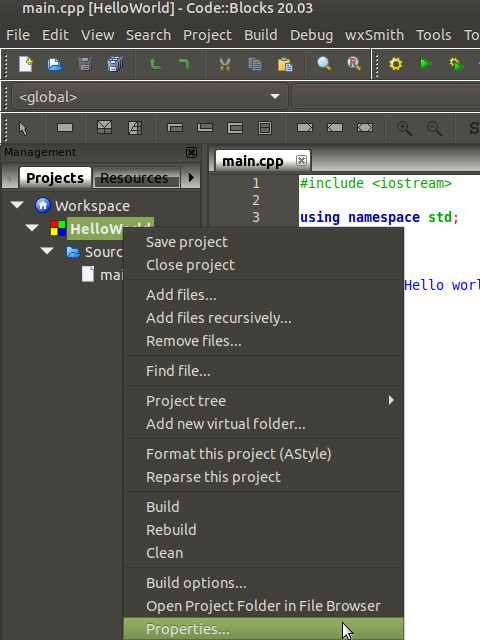
From the previous view, right click on the project name and then click on "Properties...".
In the "Project/targets options" window, click on the "Build targets" tab, and then click on the "Build options..." button.
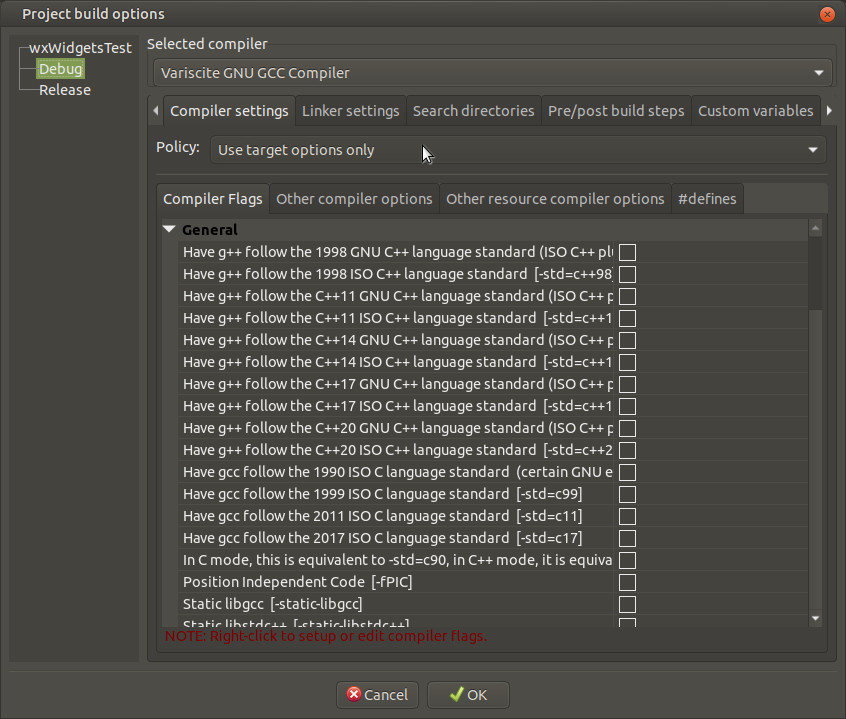
In the "Project build options" window, ensure that "Debug" is selected in the left pane. Select the "Compiler settings" tab, then select "Use target options only" from the Policy drop-down list.
Once done, ensure that "Release" is selected in the left pane, then repeat the previous step.
In the "Project build options" window, ensure that "Debug" is selected in the left pane. Select the "Linker settings" tab, then select "Use target options only" from the Policy drop-down list.
Once done, ensure that "Release" is selected in the left pane, then repeat the previous step.
In the "Project build options" window, ensure that "Debug" is selected in the left pane, then click on the "Pre/post build steps" and add the following under "Post-build steps":
/home/user/bin/var-sdk-deploy.sh $(TARGET_OUTPUT_FILE)
Once done, ensure that "Release" is selected in the left pane, then repeat the previous step, and finally, click on "OK".
In the "Project/targets options" window, scroll the tabs and click on the "Debugger" tab, then ensure "<Project>" is selected in the bottom left pane.
In the "Remote connection" tab, fill in the "IP address" and "Port" fields, with the same values of TARGET_IP and TARGET_PORT from the /home/user/bin/var-sdk.conf file.
Still in the same window, click on the "Additional shell commands" tab and add the following under "Before connection":
/home/user/bin/var-sdk-debug.sh $(TARGET_OUTPUT_FILE)
Then click on "OK".
Debug the project
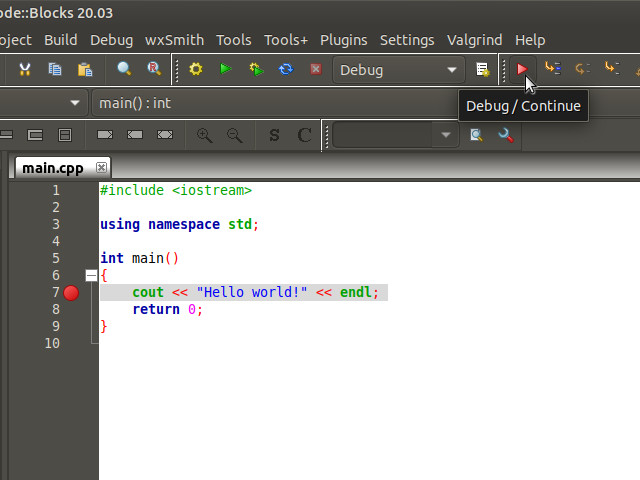
As the last step of our example, set a breakpoint by clicking to the right of the line number you want stop at, then start the debugger by clicking on the "Debug/Continue" icon.
